Category Archives: Geophysics

Gravity signals of earthquakes

A sign that an earthquake is taking place is pretty obvious: the ground moves. Seismometers are now so sensitive that they record significant seismic events at the far side of the world. The Richter magnitude scale commonly used to assign the power of an event is logarithmic, and the difference between each unit represents an approximately 32-fold change in the energy released at the source, so that a magnitude 6.0 earthquake is 32 times more powerful than one rated as magnitude 5.0. Because seismic motion affects a mass of rock it also perturbs the gravitational field. So, theoretically, gravimeters should also be able to detect an earthquake. Seismic waves travel at a maximum speed of about 6 to 8 km s-1 about 20 times the speed of sound, yet changes in the gravitational field propagate at the speed of light, i.e. almost instantaneously by comparison. The first ground disturbances of the magnitude 9.0 Tohoku-Oki earthquake of NE Japan on 11 March 2011 hit Tokyo about 2 minutes after the event began offshore. Although that is a quite short time it would be sufficient for people to react and significantly reduce the earthquake’s direct impact on many of them. A seismic gravity signal would give that warning. The full horror of Tohoku-Oki was unleashed by the resulting tsunami waves, whose speed in the deep ocean water off Japan was about 800 km hr-1 (0.22 km s-1). An almost real-time warning would have allowed 40 times more time for evasion.

Tsunami Punx

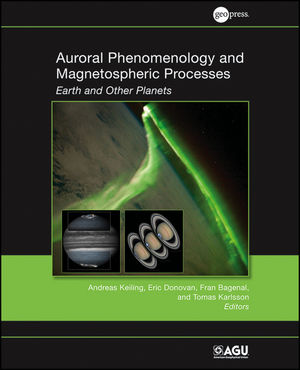
Devastation in NE Japan caused by the Tohoku-Oki tsunami in March 2011

Japan is particularly well endowed with advanced geophysical equipment because of its notorious seismic and volcanic hazards. The first data to be analysed after Tohoku-Oki were understandably those from Japan’s large array of seismometers. The records from two super-sensitive gravimeters, between 436 and 515 km from the epicentre, were examined only recently. These instruments measure variations in gravity as small as a trillionth of the average gravitational acceleration of the Earth using a superconducting sphere suspended in a magnetic field, capable of detecting snow being cleared from a roof. Masaya Kimura and colleagues from Tokyo University and other geoscientific institutes in Japan undertook the analyses of both seismic and gravity data (Kimura, M. et al. 2019. Earthquake‑induced prompt gravity signals identified in dense array data in Japan. Earth Planets and Space, v. 71, online publication. DOI: 10.1186/s40623-019-1006-x). The gravimeter record did show a statistically significant perturbation at the actual time of the earthquake, albeit after complex processing of both gravity and seismographic data.

That only 2 superconducting gravimeters detected the event in real-time is quite remarkable, despite the need for a great deal of processing. It amounts to a test of the concept that such instruments or others based on different designs and deployed more widely may eventually be deployed to give prompt warnings of seismic events that could save thousands.

Read more on Geohazards

Hot-spot track beneath the Greenland ice cap

Around 63 Ma ago, during the Palaeocene Epoch, major igneous activity broke out in what are now both sides of the North Atlantic Ocean. After initial sputtering it culminated massively between 57 and 53 Ma. Relics are to be seen in Baffin Island, West and East Greenland, the Faeroes and north-western parts of the British Islands, in the form of flood basalts, dyke swarms and scattered remnants of central volcanoes. Offshore drilling on the North Atlantic’s continental shelves suggests that the volcanism extended over 1.3 million km2 and blurted out around 6.6 million km3 of magma. Not for nothing have the products of this event been categorised as a Large Igneous Province. Its formation took place before the North Atlantic existed. It began to form as this precursor magmatic paroxysm waned.  Continued basaltic magma production created the ocean floor each side of the mid-Atlantic Ridge system to divide North America and Greenland from northern Europe. Sea floor spreading continues, rising above sea level in Iceland, which is underlain by a large mantle plume.

The plume beneath Iceland may have been present at a fixed position in the mantle for tens of million years. A hot spot over which plate movements have shifted lithosphere to be heated in a similar way to a sheet of paper dragged slowly over a candle flame. The Iceland plume may have left a hot-spot track similar to that involved in the Hawaiian island chain. The ocean floor to the east and west of Iceland is shallower and forms broad rides at right angles to the trend of the Mid-Atlantic Ridge system, judged to be such tracks that are still warm and buoyant after formation over the plume. But are there traces of earlier passage of drifting lithosphere over the plume. A way to detect older hot-spot tracks is through variations in geothermal heat flow through the continental surface, a linear pattern raising suspicions of such trace of passage. There is no sign to the east beneath Europe, so what about to the west. Greenland, being mainly blanketed in ice, is not a good place to conduct such a search as it would involve deep drilling through the ice at huge cost for each hole. But there is a roundabout way of obtaining geothermal information without even setting foot on Greenland’s icy wastes.

The geomagnetic field measured at the surface records anomalies in rock magnetisation in the solid Earth beneath. Near-surface variations due to large variations in rock types that comprise the continental crust appear as sharp, high frequency signals. Aeromagnetic surveys over Greenland are characterised by such noisy patterns because the subsurface geology is extremely complicated. However, the underlying upper mantle beneath all continents is geologically quite bland, but being uniformly rich in iron it contains a high proportion of magnetic minerals such as magnetite (Fe3O4). The upper mantle should therefore leave a signal in the surface geomagnetic field, albeit a commensurately bland one. Like radio signals that span a large range of wavelengths, Earth properties that vary spatially, such as the geomagnetic field, may be analysed using filters. Once the high-frequency geomagnetic features of the crust are filtered out what should remain is a signal that reflects the magnetic structure of the upper mantle. It should be more or less featureless, yet beneath Greenland it isn’t.

greenland hot spot

Estimated Curie depth variation below Greenland (left) converted to geothermal heat flow variation (right). (Credit: Martos et al. 2018; Figures 1b and 1c)

Magnetic anomalies are created by magnetisation induced in magnetic minerals in rocks by the Earth’s magnetic field. Yet minerals lose their ability to be magnetised at temperatures above a threshold known as the Curie point, which is 580 °C for magnetite, the most abundant magnetic mineral. Depending on the geothermal heat flow the Curie point is exceeded at some depth in the lithosphere. So magnetic anomalies can safely be assumed to be produced only by rocks above the so-called Curie depth. Yasmina Martos of the British Antarctic Survey (now at the University of Maryland) and scientists from Britain, the US and Spain used a complex procedure, including gravity data and a few direct measurements of heat flow below Greenland as well as filtered aeromagnetic data, to estimate the variation in Curie depth beneath the ice cap. (Martos, Y.M. et al. 2018. Geothermal heat flux reveals the Iceland hotspot track underneath Greenland. Geophysical Research Letters, v. 45, online publication; doi: 10.1029/2018GL078289). Using that as an inverse proxy for heat flow they were able to map the likely geothermal variation beneath the island. Rather than a random and narrow variation in depth, as would be expected for roughly uniform heat flow, the Curie depth varied in a non-random way by over 20 km, equivalent to roughly 20 mW m-2.

The shallowest Curie depth and highest estimated heat flow occurs in East Greenland around Scoresby Sund where the largest sequence of Palaeocene flood basalts occur. It is also on a line perpendicular to the mid-Atlantic Rift system that meets the active Iceland plume. Running north-west from Scoresby Sund is a zone of locally high estimated heat flow. Martos et al. suggest that this is the track of Greenland’s motion over the Iceland hot spot from about 80 Ma to the period of maximum on-shore volcanism and the start of sea-floor spreading at around 50 Ma.

A fully revised edition of Steve Drury’s book Stepping Stones: The Making of Our Home World can now be downloaded as a free eBook

A new kind of seismology

The detection and analysis of earthquake waves has played a major role in the study of how the Earth works for more than a century. Seismology has laid bare the deep structure of our planet. Using records from seismographs that showed the arrival times at different sites of body waves propagated by a 1909 earthquake near Zagreb Croatian scientist Andrija Mohorovičić deduced that the upper Earth was layered. His name is given to the boundary between the crust and underlying mantle; the Mohorovičić Discontinuity (Moho for short). Applying the principles of wave reflection and refraction to wave-arrival times from major seismic events at seismographic stations across the Earth’s surface resulted in the discovery of deeper discontinuities in the mantle and the structure of the core. As the number of stations increased, largely as a result of the need to detect and pin-point tests of nuclear weapons, reversing the principles enabled the 3-D positions of lesser events to be plotted. The resulting swathes of seismicity defined the boundaries of tectonic plates, and from the varying depths at which earthquakes occurred came ideas about their nature; especially important for the mapping of subduction zones. Expansion and standardisation of the global seismographic network and the millions of records that it has produced, together with advances in their digital analysis, has created the current method of charting deep-Earth properties using seismic tomography. A remarkable outcome of such studies is the strikingly named ‘The Atlas of the Underworld’.

Up to now there has been a limit to the scope of such studies, particularly their resolution of features in the Earth’s mantle. Almost all the recording stations are on land, leaving the 70% of the surface covered by oceans devoid of data. Yet that might be set to change. The building of the Internet’s World Wide Web has largely depended on a growing network of telecommunications optic-fibre cables that criss-cross the oceans as well as the continents, stretching about a million kilometres. Using lasers at each end of a cable and interferometric analysis of two light signal that takes up a tiny proportion of the cable’s bandwidth it is possible to detect noise due to disturbances of the cable that result from earthquakes. On land this is compromised by local effects, such as traffic noise, but the ocean floors are remarkable quiet. Giuseppe Marra of Britain’s National Physical Laboratory discovered the potential of using optic fibre while testing a 79 km length cable linking atomic clocks at NPL and Reading (Marra, G. And 11 others 2018. Ultrastable laser interferometry for earthquake detection with terrestrial and submarine cables. Science online publication; doi:10.1126/science.aat4458). Purely by chance he observed unusually high spikes in noise during 2016. By no stretch of the imagination could they have been caused by events along the course of the cable. Curious, he eventually tracked the signals down to a series of earthquakes beneath Norcia in central Italy that cause death and destruction between 24 August and 30 October 2016. With a magnitude of 6.5, the last was the largest seismic event in Italy for 36 years. Subsequently, he and colleagues picked up the signal of a far less energetic event beneath the Mediterranean Sea (magnitude 3.4) from a cable linking Malta and Sicily.

F1.large

Map of submarine optic-fibre cables (credit: TeleGeography’s Telecom Resources)

With records from three suitably equipped cables an earthquake focus could be located precisely using triangulation. Together with the recorded signals, it would also be possible to use high magnitude earthquakes detected by optic-fibre cables to add to conventional seismic tomography, thereby sharpening the 3-D images of the deep Earth, which at present are plagued by blurring of much useful detail. Since both submarine and terrestrial cables might be used, such a method may become a bonanza for geophysicists

See also: Hand, E, 2018. Seafloor fibre optic cables can listen for earthquakes. Science, v. 360, p. 1160.

A fully revised edition of Steve Drury’s book Stepping Stones: The Making of Our Home World can now be downloaded as a free eBook

Large earthquakes and the length of the day

Geoscientists have become used to the idea that long-term global climate shifts are cyclical, as predicted by Milutin Milanković. The periods of shifts in the Earth’s orbital and rotational parameters are of the order of tens to hundreds of thousand years. The gravitational reasons why they occur have been known since the 1920s when Milanković came up with his hypothesis, and they were confirmed fifty years later. But there are plenty of other cycles with shorter periods. The last 115 years of worldwide records for earthquakes with magnitudes greater than 7 whose changing annual frequency shows a clear cyclical period of about 32 years. The records show peaks in 1910, 1943, 1970 and 2011 (see Bendick, R. & Bilham, R. 1917. Do weak global stresses synchronize earthquakes? Geophysical Research Letters, v. 44 online; doi/10.1002/2017GL074934). Unlike Milanković cycles, these oscillations were not predicted, but something synchronous with them must be forcing this behavior: a sort of “cross-talk”. Either global seismicity has a tendency for events to trigger others elsewhere on the Earth or some other process is periodically engaging with major brittle deformation to give it a nudge.

Rebecca Bendick, of the University of Montana, Missoula, and Roger Bilham of the University of Colorado, Boulder used a complex statistical method to check for synchronicity between the seismic cycles and other repetitive phenomena. It turns out that there is a close match with historic data for the length of the day which varies by several milliseconds. At first sight this may seem odd, until one realizes that day length is governed by the Earth’s speed of rotation (about 460 m s-1 at the Equator). The correlation is between increases in both major seismicity and the length of the day; i.e. quakes increase as rotation slows.  Day length can vary by a millisecond over a year or so during el Niño, which involves shifts of vast masses of Pacific Ocean water that affect rotation. But what of larger changes on a three-decade cycle? Seismic events and the forces that they release result from buildup of strain in the lithosphere, so the episodic earthquake maxima require some kind of transfer of momentum within the Earth. It does not need to be large, as the Milanković astronomical forcing of climate demonstrates, just a regular pulse.

One possibility is that, as rotation decelerates, decoupling between the liquid outer core and the solid mantle may change the flow of molten iron-nickel alloy.  That may be sufficient to transmit momentum and thus stress through the plastic mantle to the brittle lithosphere so that areas of high elastic strain are pushed beyond the rocks’ strength so that they fail. There are indeed signs that the geomagnetic field also changes with day length on a decadal basis (Voosen, P. 2017. Sloshing of Earth’s core may spike big quakes. Science, v. 358, p. 575; doi:10.1126/science.358.6363.575). Rotational deceleration began in 2011, and if the last century’s trend holds there may be an extra five large earthquakes next year. Could the deadly 7.3 magnitude earthquake at the Iran-Iraq border on 12 November 2017 be the start? If so, will the 32-year connection improve currently unreliable earthquake forecasting? Probably the best we can expect is increased global readiness. The study has nothing to add as regards which areas are at risk: although there is clustering in time there is none with location, even on the regional scale.

A fully revised edition of Steve Drury’s book Stepping Stones: The Making of Our Home World can now be downloaded as a free eBook


http://www.gettyimages.com/detail/news-photo/iranians-salvage-their-furniture-and-household-appliances-news-photo/874026786
Iranians salvage their furniture and household appliances from damaged buildings in the town of Sarpol-e Zahab in Iran’s western Kermanshah province near the border with Iraq, on November 14, 2017

Plate tectonic graveyard

Where do old plates go to die? For the most part, down subduction zones to mix with their original source, the mantle. Earth-Pages has covered evidence for quite a few of the dead plates, which emerges from a geophysical technique known as seismic tomography – analogous to X-ray or magnetic resonance scans of the whole human body. For 20 years geophysicists have been analysing seismograms from many stations across the globe for every digitally recorded earthquake, i.e. virtually all of those since the 1970s. This form of depth sounding goes far beyond early deep-Earth seismometry that discovered the inner and outer core, various transition zones in the mantle and measured the average variation with depth of mantle properties. Tomography relies on complex models of the paths taken by seismic body waves and very powerful computing to assess variations in the speed of P- and S-waves as they travelled through the Earth: the more rigid/cool the mantle is the faster waves travel through it and vice versa. The result is images of deep structure in 2-D slices, but the quality of such sections depends, ironically, on plate tectonics. Most earthquakes occur at plate boundaries. Such linearly distributed, one-dimensional sources inevitably leave the bulk of the mantle as a blur. Around 20 different methodologies have been developed by the many teams working on seismic tomography. So sometimes conflicting images of the deep Earth have been produced.

Results of seismic tomography across Central America showing anomalously fast (in blue) P- (top) and S-wave (bottom) speeds in map view at a fixed mantle depth (1290 km, left) and as vertical sections (right). The blue zones at right are interpreted to show a steeply dipping slab that represents subduction of the eastern Pacific Cocos plate since about 175 Ma ago (credit: van der Meer, D.G et al. ‘Atlas of the Underworld)

The technique has come of age now that superfast computing and use of multiple models have begun to resolve some of tomography’s early problems. The latest outcome is astonishing: ‘The Atlas of the Underworld’ catalogues 94 2-D sections from surface to the core-mantle boundary each of which spans 40° or arc – about a ninth of the Earth’s circumference (see: van der Meer, D.G., van Hinsbergen, D.J.J., and Spakman, W., 2017, Atlas of the Underworld: slab remnants in the mantle, their sinking history, and a new outlook on lower mantle viscosity, Tectonophysics online; doi.org/10.1016/j.tecto.2017.10.004). Specifically, the Atlas locates remnants of relatively cold slabs in the mantle that are suspected to be remnants of former subduction zones, or those that connect to active subduction. The upper parts of active slabs are revealed by the earthquakes generate along them. At deeper levels they are too ductile to have seismicity, so what form they take has long been a mystery. Once subduction stops, so do the telltale earthquakes and the slabs ‘disappear’.

The slabs covered by the ‘Atlas’ only go back as far as the end of the Permian, when the current round of plate tectonics began as Pangaea started to break-up. It takes 250 Ma for slabs to reach the base of the mantle and beyond that time they will have heated up and begun to be mixed into the lower mantle and invisible. Nevertheless, the rich resource allows models of vanished Mesozoic to Recent plates and the tectonics in which they participated, based on geological information, to be evaluated and enriched. Just as important, the project opens up the possibility of finding out how the mantle ‘worked’ since Pangaea broke up, in 3-D; a key to more than plate tectonics, including the mantle’s chemical heterogeneity. Already it has been used to estimate changes in the total length of subduction zones since 250 Ma ago, and thus arc volcanism and CO2 emissions, which correlates with estimates of past atmospheric CO2 levels, climate and even sea levels.

See also:  Voosen, P. 2016. ‘Atlas of the Underworld’ reveals oceans and mountains lost to Earth’s history. Science; doi:10.1126/science.aal0411.

Lee, H. 2017. The Earth’s interior is teeming with dead plates. Ars Technica UK, 18 October 2017.

Seismic menace of the Sumatra plate boundary

More than a decade after the 26 December 2004 Great Aceh Earthquake and the Indian Ocean tsunamis that devastating experience and four more lesser seismic events (> 7.8 Magnitude) have show a stepwise shift in activity to the SE along the Sumatran plate boundary. It seems that stresses along the huge thrust system associated with subduction of the Indo-Australian Plate that had built up over 200 years of little seismicity are becoming unlocked from sector to sector along the Sumatran coast. Areas further to the SE are therefore at risk from both major earthquakes and tsunamis. A seismic warning system now operates in the Indian Ocean, but the effectiveness of communications to potential victims has been questioned since its installation. However, increasing sophistication of geophysical data and modelling allows likely zones at high risk to be assessed.

Recent Great Earthquakes in different segments of the Sumatra plate margin (credit: Tectonics Observatory, California Institute of Technology http://www.tectonics.caltech.edu/outreach/highlights/sumatra/why.html

Recent Great Earthquakes in different segments of the Sumatra plate margin (credit: Tectonics Observatory, California Institute of Technology http://www.tectonics.caltech.edu/outreach/highlights/sumatra/why.html

One segment is known to have experienced giant earthquakes in 1797 and 1833 but none since then. What is known as the Mentawai seismic gap lies between two other segments in which large earthquakes have occurred in the 21st century: it is feared that gap will eventually be filled by another devastating event. Geophysicists from the Institut de Physique du Globe de Paris and Nanyang Technological University in Singapore have published a high-resolution seismic reflection survey showing the subduction zone beneath the Mentawai seismic gap (Kuncoro, A.K. et al. 2015. Tsunamigenic potential due to frontal rupturing in the Sumatra locked zone. Earth and Planetary Science Letters, v. 432, p. 311-322). It shows that that the upper part of the zone, the accretionary wedge, is laced with small thrust-bounded ‘pop-ups’. The base of the accretionary wedge shows a series of small seaward thrusts above the subduction surface itself forming ‘piggyback’ or duplex structures.

Seismic reflection profile across part of the Sumatra plate boundary, showing structures produced by past seismicity. (credit: Kuncoro et al. 2015, Figure 3b)

Seismic reflection profile across part of the Sumatra plate boundary, showing structures produced by past seismicity. (credit: Kuncoro et al. 2015, Figure 3b)

The authors model the mechanisms that probably produced these intricate structures. This shows that the inactive parts of the plate margin have probably locked in stresses equivalent to of the order of 10 m of horizontal displacement formed by the average 5 to 6 cm of annual subduction of the Indo-Australian Plate over the two centuries since the last major earthquakes. Reactivation of the local structures by release of this strain would distribute it by horizontal movements of between 5.5 to 9.2 m and related 2 to 6.6 m vertical displacement in the pop-ups. That may suddenly push up the seafloor substantially during a major earthquake, thereby producing tsunamis. Whether or not this is a special feature of the Sumatra plate boundary that makes it unusually prone to tsunami production is not certain: such highly resolving seismic profiles need to be conducted over all major subduction zones to resolve that issue. What does emerge from the study is that a repeat of the 2004 Indian Ocean tsunamis is a distinct possibility, sooner rather than later.

The core’s influence on geology: how does it do it?

Although no one can be sure about the details of processes in the Earth’s core what is accepted by all is that changes in core dynamics cause the geomagnetic field to change in strength and polarity, probably through some kind of physical interaction between core and deep mantle at the core-mantle boundary (CMB). Throughout the last 73 Ma and especially during the Cenozoic Era geomagnetism has been more fickle than at any time since a more or less continuous record began to be preserved in the Jurassic to Recent magnetic ‘stripes’ of the world ocean floor. Moreover, they came in bursts: 5 in a million years at around 72 Ma; 10 in 4 Ma centred on 54 Ma; 17 over 3 Ma around 42 Ma; 13 in 3 Ma at ~24 Ma; 51 over a period of 12 Ma centring on 15 Ma. During the Late Jurassic and Early Cretaceous the core was similarly ‘busy’, the two time spans of frequent reversals being preceded by quiet ‘superchrons’ dominated by the same normal polarity as we have today i.e. magnetic north being roughly around the north geographic pole.

The Cenozoic history of magnetic reversals - black periods were when geomagnetic field polarity was normal and white when reversed. (credit: Wikipedia)

The Cenozoic history of magnetic reversals – black periods were when geomagnetic field polarity was normal and white when reversed. (credit: Wikipedia)

Until recently geomagnetic ‘flips’ between the two superchrons were regarded as random , perhaps suggesting chaotic behaviour at the CMB. But such a view depends on the statistical method used. A novel approach to calculating reversal frequency through time, however, shows peak-trough pairs recurring 5 times through the Cenozoic Era, approximately 13 Ma apart: maybe the chaos is illusory (Chane, J. et al. 2015. The 13 million year Cenozoic pulse of the Earth. Earth and Planetary Science Letters, v. 431, p. 256-263). So, here is a kind of yardstick to see if there may be any connection between core processes and those at the surface, which Chen of the Fujian Normal University, Fushou China and Canadian and Chinese colleagues compared with the very detailed Cenozoic oxygen-isotope (δ18O) record preserved by foraminifera in ocean-floor sediments, which is a well established proxy for changes in climate. Removing the broad trend of cooling through the Cenozoic resulted in a plot of more intricate climatic shifts that matches the geomagnetism record in both shape and timing of peak-trough pairs. It also turns out, or so the authors claim, that both measures correlate with changes in the rate of Cenozoic subduction of oceanic lithosphere (a measure of plate tectonic activity), albeit negative – peaks in magnetism and climate connecting with slowing in the pace of tectonics.

The analyses involved some complicated maths, but taken at face value the correlations beg the questions why and how? Long-term climate change contains an astronomical signal, encapsulated in the Milankovich hypothesis which has been tested again and again with little room for refutation. So is this all to do with gravitational influences in the Solar System. More exotic still is the possibility of 13 Ma cyclicity linking the Milankovich mechanism with the vaster scale of the Sun’s orbit oscillating through the disc of the Milky Way galaxy and theoretical hints of a mysterious role for dark matter in or near the galaxy. Or, is it a relationship in which climate and the magnetic field are modulated by plate tectonics through varying volcanic emissions of greenhouse gases and the deep effect of subduction on processes at the CMB respectively? To me that seems more plausible, but it is still as exceedingly complex as the maths used to reveal the correlations.

Continental hot-spot track in eastern Australia

cosgrove volcano track shown on map of australia

The Cosgrove volcanic track on a natural-colour image mosaic of Australia (credit: Drew Whitehouse, NCI National Facility VizLab)

It is sometimes forgotten that not only oceanic lithosphere provides evidence for hot spot tracks, probably because they are so obvious as island and seamount chains on bathymetric maps. They are not so clear on continents, either because of erosion of volcanoes or topography dominated by features that predate volcanism, but they account for about 20% of proposed tracks. Eastern Australia seems well endowed; four of them marked by a variety of volcanic structures that trend parallel to the Indo-Australian Plate’s NNE Cenozoic drift powered by the Southeast Indian Ridge that separates it from the Antarctic Plate. The timing of the volcanism along the proposed tracks is also highly persuasive. The longest of the tracks, extending about 2000 km SSW from Cape Hillsborough on the coast of central Queensland through New South Wales to Cosgrove in Victoria, is marked by sporadic volcanoes whose age decreases from Late Eocene in the north to Late Miocene in Victoria.

Unlike oceanic hot-spot tracks, those on continents are not continuous lines of volcanic occurrences. The Cosgrove track has several volcanic gaps, up to 650 km wide. This kind of patchy feature once encouraged hot-spot sceptics to question the tectonic affinities of what they regarded as fortuitous alignments. Where volcanic age trends consistent with the hypothesis emerged such doubts have faded into the background academic ‘noise’. In the case of the Cosgrove track all but one of the dates of volcanism tally quite well with the Cenozoic absolute motion of the Indo-Australian Plate and their position along the track (Davies, D.R. et al 2015. Lithospheric controls on magma composition along Earth’s longest continental hotspot track. Nature, v. 525, p. 511-514). Yet the objective of the authors, from the Australian National University and the University of Aberdeen in Britain, was not merely to establish the alignment as a hot-spot track, but to suggest what may have resulted in its marked patchiness.

The geochemistry of lavas from the volcanoes turns out to be of two fundamentally different types: ‘common-or-garden’ basalts in the case of Queensland and peculiar potassium-rich basalts containing the K-feldspathoid leucite in New South Wales and Victoria. Why these compositional differences occur where they do emerged very clearly when their positions were plotted on a new map of the thickness variations of the eastern Australian continental lithosphere. The ordinary basalts rest on the thinnest lithosphere (£110 km), whereas the leucitites are underlain by considerably thicker lithosphere (~135 km). This suggests that the rising mantle whose partial melting produced the magmas was halted at different depths, different geochemical ‘signatures’ of basalts depending on the pressure of melting. The most interesting outcome, albeit one based on an absence of evidence, is that the very large volcanic gaps along the track are each above much thicker lithosphere (>150 km). At those depths a rising mantle plume would be much less likely to begin melting.

Hotspots and plumes

One of the pioneers of plate tectonics, W. Jason Morgan, recognised in the 1970s that chains of volcanic islands and seamounts that rise from the ocean floor may have formed as the movement of lithospheric plates passed over sources of magma that lay in the mantle beneath the plates. He suggested that such hotspots were fixed relative to plate movements at the surface and likened the formation of chains such as that to the west of the volcanically active of the Hawaiian ‘Big Island’ to linear scorching of a sheet of paper moved over a candle flame. If true, it should be possible to use hotspots as a framework for the absolute motion of lithospheric plates rather than the velocities of individual plates relative to the others. But Morgan’s hypothesis has been debated ever since he formulated it. A test would be to see whether or not plumes of rising hot material in the deep part of the mantle can be detected. This became one of the first objectives of seismic tomography when it was devised in the last decade of the 20th century: a method that uses global earthquakes records to detect parts of the mantle where seismic waves traveled faster or slower than the norm: effectively patches of hot (probably rising) and cold rock. The first such evidence was equally hotly debated, one view being that the magma sources beneath oceanic islands such as Hawaii and Iceland were actually related to plate tectonics and that the hotspot hypothesis had become a kind of belief system.

English: global distribution of 45 identified ...

Global distribution of hotspots ( credit: Wikipedia)

The problem was that mantle plumes supposedly linked to magmatic hotspots in the upper mantle would be so thin that they would be difficult to detect even with seismic tomography. Geophysicists have been trying to sharpen up seismic resolution partly by using supercomputers to analyse more and more seismic records and also by improving the theory about how seismic waves interact with 3-D mantle structure. This has culminated in more believable visualisation of mantle structure (French, S.W. & Romanowicz, B. 2015. Broad plumes rooted at the base of the Earth’s mantle beneath major hotspots). The two researchers from the University of California at Berkeley in fact showed something different, but still robust support for Morgan’s 40-year old ideas. Instead of thin plumes, they have been able to show much broader conduits beneath at least 5 and maybe more active ends of hotspot chains. The zones extend upwards from the core-mantle boundary to about 1000 km below the Earth’s surface, where some bend sideways towards hotspots, perhaps as a result of another kind of upper mantle circulation.

Whole-Earth seismic tomography cross sections beneath a variety of volcanic islands, (Credit French and Romanowicz; http://www.nature.com/doifinder/10.1038/nature14876)

Whole-Earth seismic tomography cross sections beneath a variety of volcanic islands, (Credit French and Romanowicz; http://www.nature.com/doifinder/10.1038/nature14876)

The sources of these hot columns at the core-mantle boundary appear to be zones of very low shear-wave velocities; i.e. almost, but not quite molten blobs. French and Romanowicz suggest that the columns are extremely long-lived and may even have a chemical dimension – as in the hypothesis of mantle heterogeneity. Another interesting feature of their results is that the striking vertical linearity of the columns could indicate that the overall motion of the lower mantle is extremely sluggish and punctured by discrete convection.

Thin- or thick-skinned tectonics: a test

How the continental lithosphere deforms at convergent plate margins has been a matter of opinion that depends on where observations have been made in ancient orogenic belts. One view is that arc and collisional orogens are dominated by deformation of the upper crust and especially the cover of sedimentary and volcanic rocks above deeper and older basement. This is a ‘thin-skinned’ model in which rocks of the upper crust are detached from those below and thicken more or less independently by thrust faulting, the formation of ductile nappes or a combination of the two. Mountain ranges, in this view, are the product of piling up of thrust slices or nappes, as exemplified by the Alps, Canadian Rockies and the Caledonian thrust belt of NW Scotland. Thick-skinned processes, as the name suggests, see crustal shortening and thickening as being distributed through the crust from top to bottom and even involving the lithospheric mantle. The hinterlands of both the Alps and the Scottish Caledonides show plenty of evidence for entire-crust deformation, deep crustal rocks being found sheared together with deformed rocks of the cover. It stands to reason that orogenic processes on the grand scale must involve a bit of both.

Both hypotheses stem from field work in deeply eroded, structurally complex segments of the ancient crust, and it is rarely if ever possible to say whether both operated together or one followed the other during the often lengthy periods taken by orogeny to reach completion, and the sheer scale of the process. Orogenesis is going on today, to which major seismic activity obviously bears witness. But erosion has not progress from cover through basement so, up to now, only seismicity and geodetic GPS measurements have been available to show that continental crust in general is being shortened and thickened, as well as being moved about. Potentially, a means of assessing active deformation, even in the deep crust, is to see whether or not the speeds of seismic waves at different depths are biased depending on their direction of travel. Such anisotropy would develop if the mineral grains making up rocks were deformed and rotated to preferred directions; a feature typical of metamorphic rocks. But to make such measurements on the scale of active orogens requires a dense network of seismometers and software that can tease directionality and depth out of the earthquake motions detected by it.

LS-tectonite from the Paraiba do Sul Shear Zon...

Aligned minerals in a Brazilian metamorphic rock (credit: Eurico Zimbres in Wikipedia)

A joint Taiwanese-American consortium set up such a network in Taiwan, which is capable of this type of seismic tomography. Taiwan is currently taking up a strain rate of 8.2 cm per year due to motion of the Philippine Plate on whose western flank the island lies: it is part of an island arc currently colliding with the stationary Eurasian Plate and whose crust is shortening. Results of seismic anisotropy (Huang, T.-Y. et al. 2015. Layered deformation in the Taiwan orogen. Science, v. 349, p. 720-723) show that the fast direction of shear (S) waves changes abruptly at about 10 to 15 km deep in the crust. In the upper crust this lines up with the roughly N-S structural ‘grain’ of the orogen. At between 13 to 17 km down there is no discernible anisotropy, below which it changes to parallel the direction of plate motion, ESE-WNW. It seems that thin skinned tectonics is indeed taking place, although probably not above a structural detachment. Simultaneously the deep crust is being deformed but the shearing is ascribed to the descent of lithospheric mantle of the Philippine Plate beneath the Eurasian Plate, while the deep crust remains attached to the upper crust. If it were possible to examine the mineral lineations now forming in both the Taiwanese upper and lower crust where metamorphism is active, then the two directions would be apparent. Although not mentioned by the authors, perhaps the detection of different directionality of aligned metamorphic minerals in low- and high-grade metamorphic rocks might indicate such tectonic processes in the past.